Best Infographics Techniques For Your WordPress Website

Infographics are quickly becoming one of the most attractive ways to spread marketing messages. Infographics are basically the graphical representation of the information.
Colored charts and illustrations are known to bond better connection with the reader than long texts and bullet points. Now-a- days there are several online tools to create Infographics. I have picked up few of the best tools that I have found out to be very helpful.
Benefits of Infographics
- Easy to read and understand – It helps to pass message quickly and in an interesting manner
- Easy to be shared on social media – These can be easily shared on social media and they also have a great potential to go viral
- It can help to increase your blog traffic – People tend to click on your infographic and land to your site
- Branding Purposes – The logo and company name on your Infographic will help to increase your brand awareness
- Can lift you as an expert – Sharing an Infographic requires you to thorough research on the subject, hence it will help to become a known expert matter expert
Must Read: Top 10 reasons to use infographic marketing
Tips on how to create the best Infographics
- Create a vertical Infographics – According to the statistics vertical infographics attract more attention and are also tweeted more.
- Create catchy headlines – Make sure to create catchy and interesting headlines which will help users to get attracted to your infographics
- Branding on Infographics – Always make sure to include brand name, logo or URL
- Post HTML share code – This code is pasted on the infographic and hence can be easily shared on any of the social media platforms
- Use good color combinations – Use good color combinations to highlight what is written and grab users attention at the same time
Best Infographic design tools
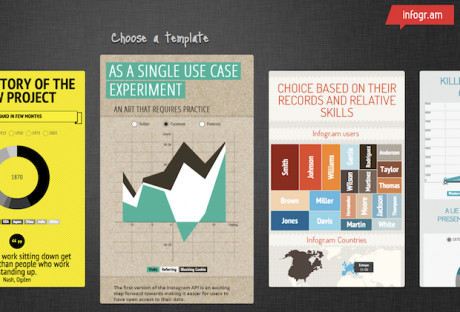
Infogr.am
Infogr.am is a free tool that comes along with some really nice themes and great interface for creating simple infographics. This tool allows you to create charts as there are 31 options to choose from, that offer cool displays, like a radial bar graph, scatter charts, bubble graphs, and map charts. You are also allowed to add your own images and videos. When you’re done creating your Infographic, all you need to do is to simply embed it on a website. There wasn’t a way to download it. This app is currently in the beta phase however, seems very quite robust to me.
Canva
Canva offers a free, simple to use platform that contains hundreds of fonts and millions of images to incorporate into an infographic. Premium images are only $1 each, and the photos can be edited right within the program. You can share and edit your infographics with coworkers at any point in the creation process.. It is an amazing tool for the clueless, and can come in handy for professionals too. It makes designing uniformly easy for everyone, but it’s by no means aimed only at amateurs. Even if you’re not that tech savvy, you won’t find a big learning curve because every design element can be dragged and dropped it into place. The simplicity and richness of the tools will get you coming back for more every day.

This infographic by “Jing Zhang” uses a very successful color scheme. The colors work well together and are easy on the eyes. Three main colors are used (greenish blue, orange, and yellow) and various tints and shades of those colors are added in to provide contrast.
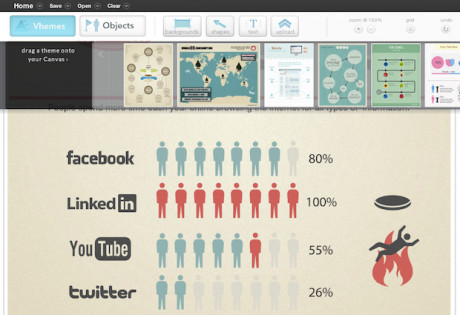
Easel.ly
Easel.ly is a good web-based tool for creating free infographics. One cannot create graphs using this tool however, it is ideal for conceptual visualizations and storytelling. It has a superb user interface and the themes support many purposes such as maps, flow-chart, and comparison/relationship graphing etc. This tool has a good selection of design objects such as people, Icons, landmarks, maps, animals and lots more. You can also upload your own images with this free version and download a version of JPG. Just as Inforgr.am this tool is also in beta phase, but it worked just fine without any hiccups.
Visual.ly
Visual.ly is another free tool that has some simple but good features which are worth mentioning. Its features help it to integrate with social networks to analyze Twitter and Facebook data. You can create venn diagrams, visuals that analyze hash tags, and a few others. However the only drawback is that there’s almost no customization available. It offers a marketplace where you can get connected with visual designers and graphics artists who specialize in creating infographics. The site also has tonnes of graphics to inspire you or your designers.

A Final Tip
If you are interested to get even traction out of the infographics that you create, always make sure that you have your website URL and other information on that piece of graphic.
You can freely use infographics on your own site or any social media platforms. This tool greatly helps to promote your company no matter where the infographic is displayed. We cant be sure for how long can infographics play an important part to attract traffic on your sites. However, it is always wise to keep up with the online trends for your blog, that can be quite helpful for your site’s popularity.
Please share your thoughts and experiences around infographics and do let us know, what results do you get after trying the techniques mentioned in the above article.

Leave a Reply